Db Scaling — 20260825T005436Z
Run 20260825T005436Z-b450b0a9-db-scaling · commit 085c0954e1dc · 2026-08-25 11:09 UTC
Validity guards passed
No swapping, no OOM kills, no unexpected restarts, disk headroom kept, load generator below its own ceiling, monitoring coverage complete.
Headline
| finding | value | evidence |
|---|---|---|
| peak single-replica throughput | 98.4 | sat-D1-c4-r3 at 4 clients, p95 63 ms |
| sustainable single-replica capacity (C1) | 98.4 | highest successful rps over valid measurements with p95 within the 2.0s SLO and errors under 1% |
What was measured
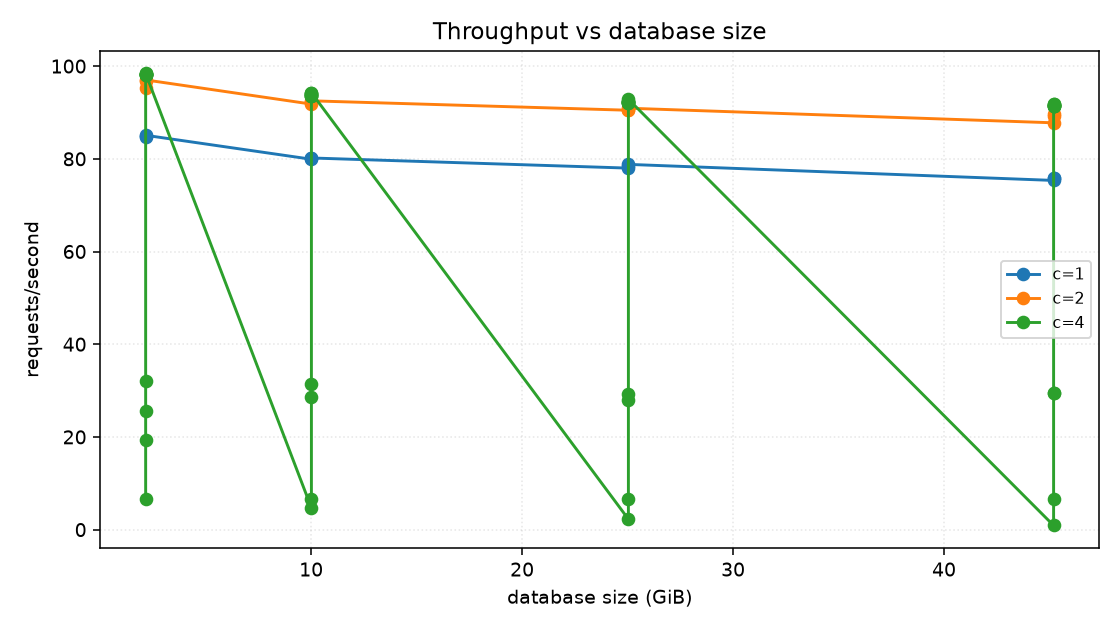
| dataset | size | ObsCore rows | total rows | index/table | generation |
|---|---|---|---|---|---|
| D1 | 2.16 GiB | 700,090 | 8,867,059 | 0.63 | 4 s |
| D2 | 10.01 GiB | 3,000,213 | 41,925,949 | 0.63 | 1,240 s |
| D3 | 25.04 GiB | 7,399,024 | 105,153,894 | 0.63 | 2,499 s |
| D4 | 45.19 GiB | 13,299,270 | 189,965,490 | 0.63 | 3,561 s |
Sizes are pg_database_size() with indexes — not row counts times an
assumed row width. One database is grown through every target, so each
tier is a genuine prefix of the next.
Throughput and latency against concurrency
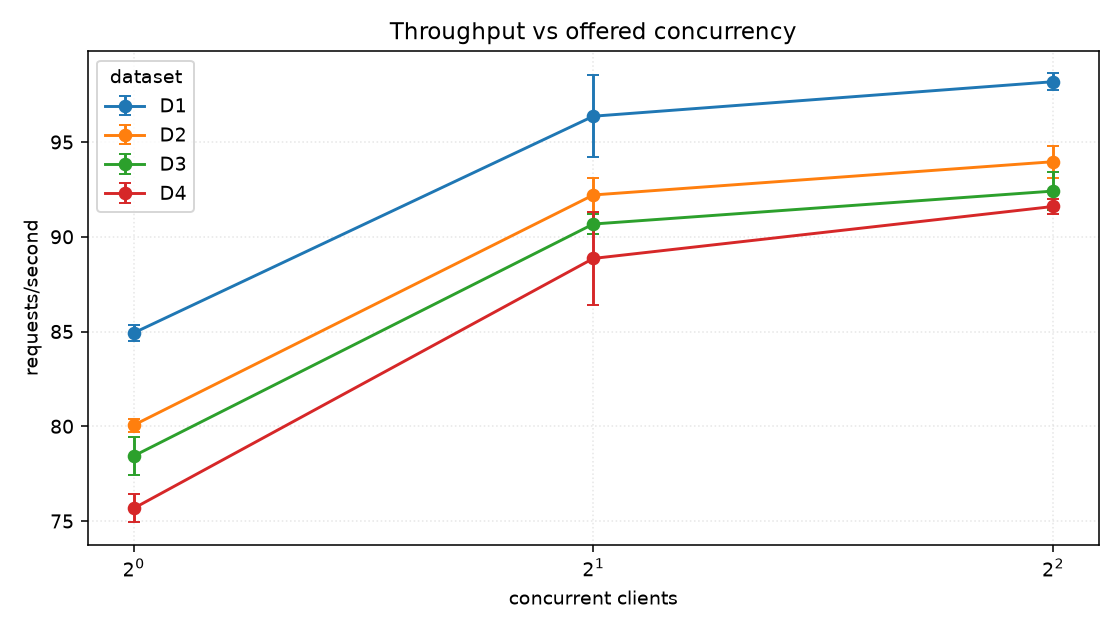
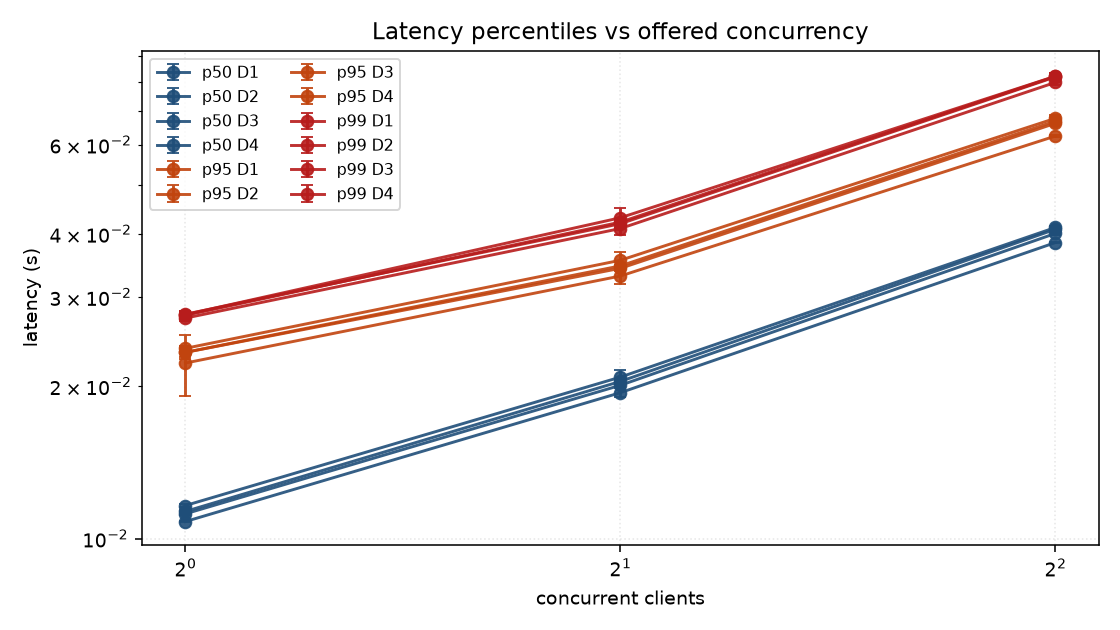
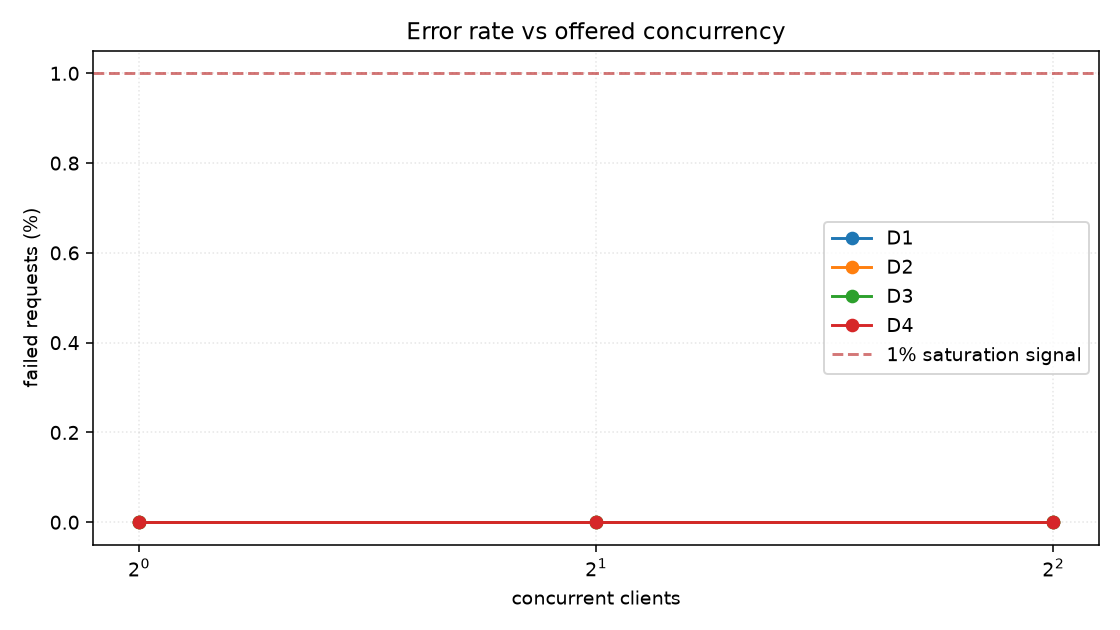
| dataset | clients | reps | requests/s | p95 (ms) | errors | bottleneck |
|---|---|---|---|---|---|---|
| D1 | 1 | 3 | 84.9 ± 0.4 | 22 | 0.00% | MEMORY_BOUND |
| D1 | 2 | 3 | 96.4 ± 2.2 | 33 | 0.00% | TAP_CPU_BOUND |
| D1 | 4 | 8 | 98.2 ± 0.1 | 63 | 0.00% | TAP_CPU_BOUND |
| D2 | 1 | 3 | 80.1 ± 0.4 | 23 | 0.00% | UNKNOWN |
| D2 | 2 | 3 | 92.2 ± 0.9 | 34 | 0.00% | TAP_CPU_BOUND |
| D2 | 4 | 8 | 93.9 ± 0.2 | 66 | 0.00% | TAP_CPU_BOUND |
| D3 | 1 | 3 | 78.4 ± 1.0 | 23 | 0.00% | DATABASE_IO_BOUND |
| D3 | 2 | 3 | 90.7 ± 0.6 | 35 | 0.00% | TAP_CPU_BOUND |
| D3 | 4 | 8 | 92.3 ± 0.2 | 67 | 0.00% | TAP_CPU_BOUND |
| D4 | 1 | 3 | 75.7 ± 0.7 | 24 | 0.00% | DATABASE_IO_BOUND |
| D4 | 2 | 3 | 88.9 ± 2.4 | 35 | 0.00% | TAP_CPU_BOUND |
| D4 | 4 | 8 | 91.6 ± 0.1 | 68 | 0.00% | TAP_CPU_BOUND |
Intervals are 95% Student-t across repetitions. The sweep stops when two saturation signals agree, so the last row of a dataset is where that dataset's ceiling was found rather than where the ladder ran out.
Where the limit was
| classification | measurements | meaning |
|---|---|---|
TAP_CPU_BOUND |
48 | The API's own CPU is the constraint: it sat at its ceiling, or was CFS-throttled, for a material part of the window. The ceiling compared against is min(pod CPU limit, workers), not the pod limit: ADQL translation is pure-Python and holds the GIL, so one worker cannot exceed one core whatever the cgroup allows. Relieved by more processes (tapApi.workers) or more pods, never by a bigger limit on one worker. |
DATABASE_IO_BOUND |
16 | The working set does not fit in shared_buffers plus page cache: the database is fetching from disk. This is the class that appears as the dataset grows and is the reason the size sweep exists. |
UNKNOWN |
15 | Nothing saturated by these rules. Either the offered load was below every ceiling, or the limit is somewhere this suite does not instrument — which is itself worth knowing. |
DATABASE_CPU_BOUND |
4 | PostgreSQL is CPU-bound. Adding API replicas cannot help and will make it worse; this needs cheaper plans, fewer rows, or a bigger database. |
SERIALIZATION_BOUND |
4 | Large responses with a busy API and an idle database: the time is going into formatting and streaming rows, not into finding them. This is a result-pipeline cost, not a query cost. |
MEMORY_BOUND |
1 | A container approached or exceeded its memory limit. An OOM kill invalidates the run outright; sustained pressure below it still distorts latency through reclaim. |
Query plans
| flag | plans | why it matters |
|---|---|---|
bad_cardinality_estimate |
36 | The planner's row estimate was an order of magnitude out, which is how good indexes get ignored. |
large_nested_loop |
1 | A nested loop executed its inner side thousands of times; usually a cardinality misestimate upstream. |
large_rows_removed_by_filter |
1 | The plan fetched rows only to throw them away - work done for nothing, and usually a missing or wrong-ordered index. |
Graphs
Throughput against offered concurrency
Latency percentiles against concurrency
Errors against concurrency
Throughput against database size
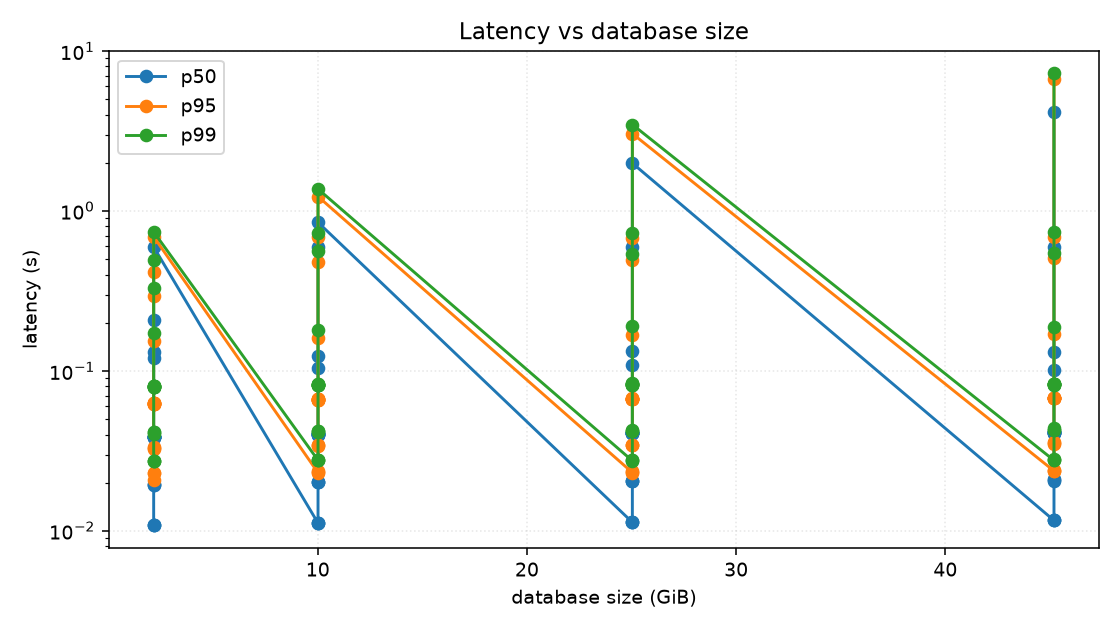
Latency against database size
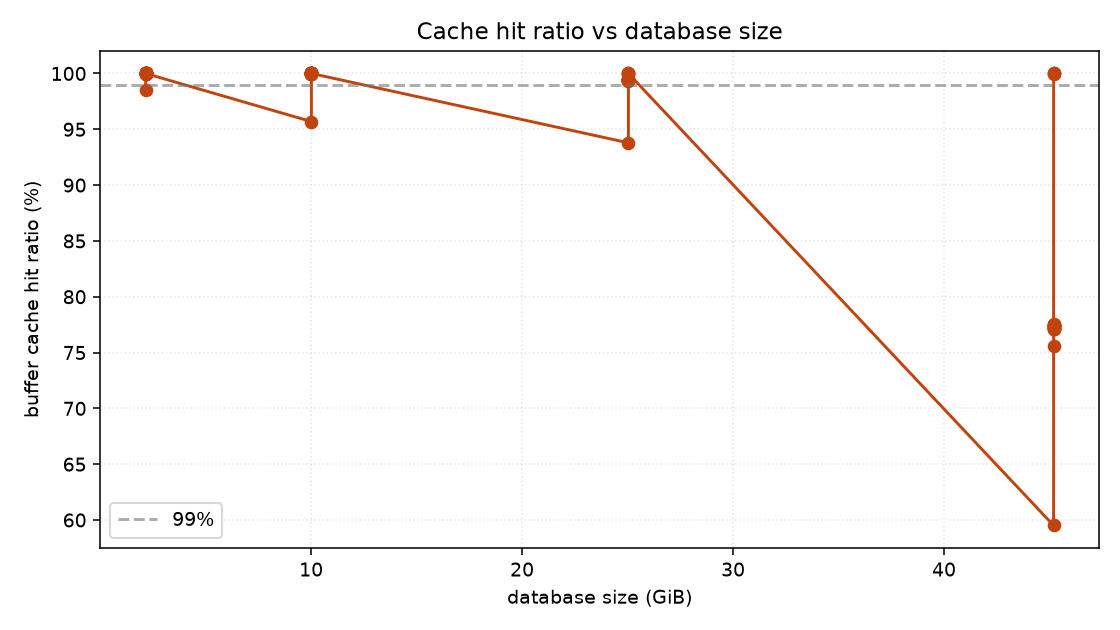
Buffer cache hit ratio against database size
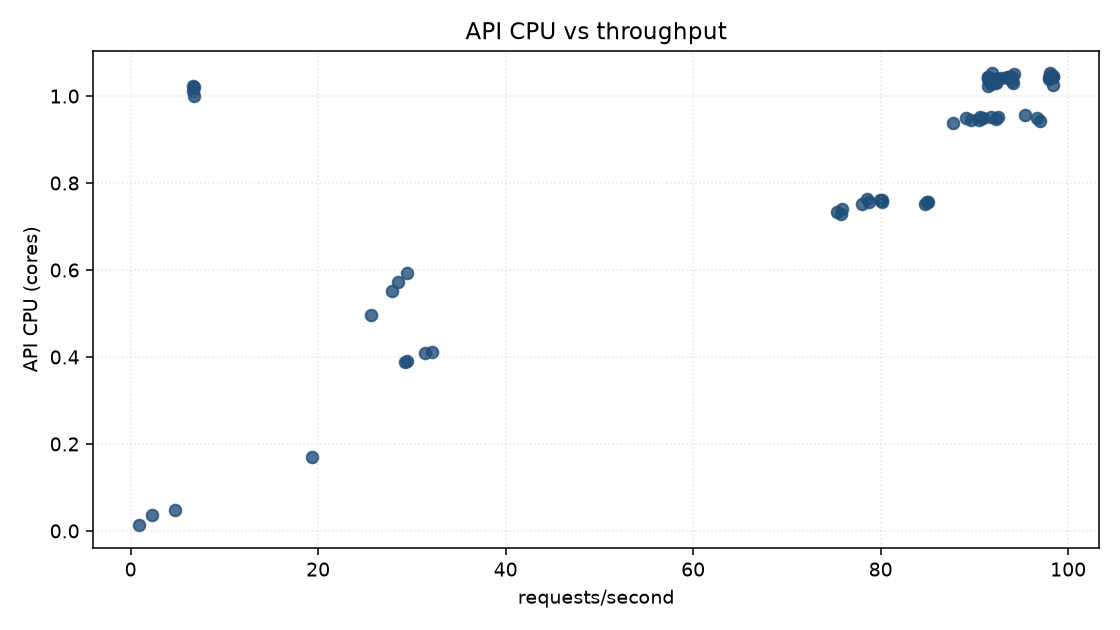
API CPU against throughput
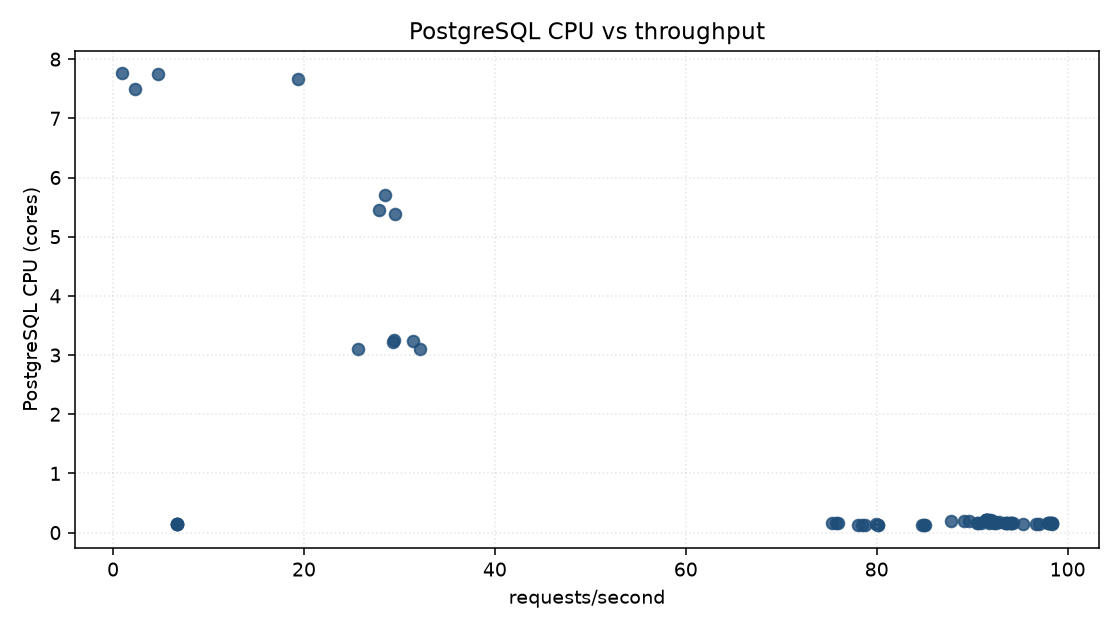
PostgreSQL CPU against throughput
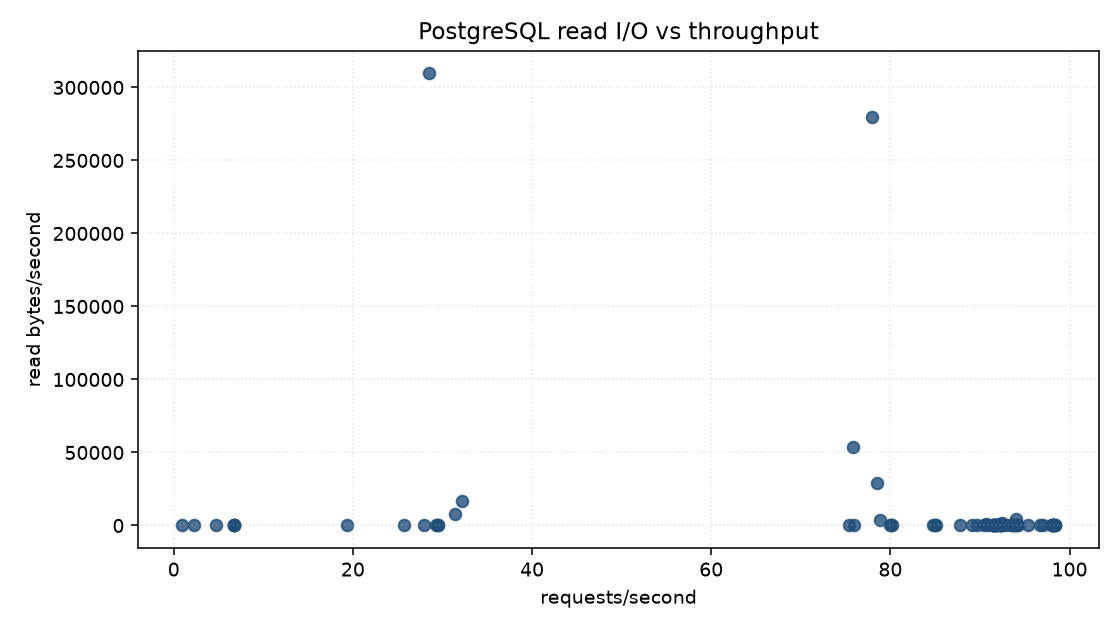
PostgreSQL read I/O against throughput
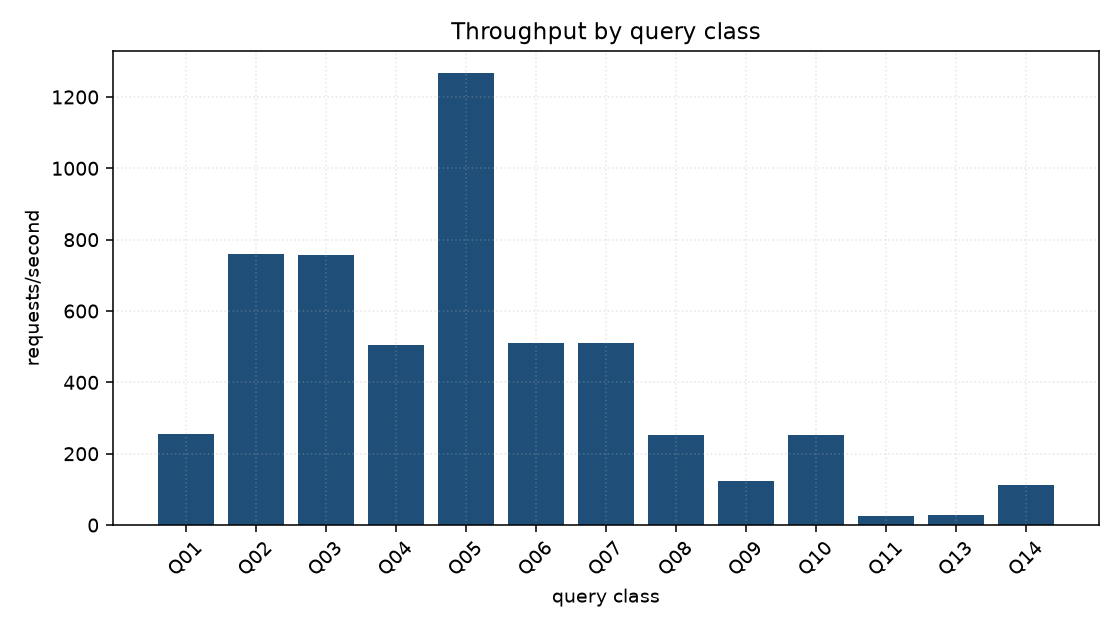
Throughput by query class
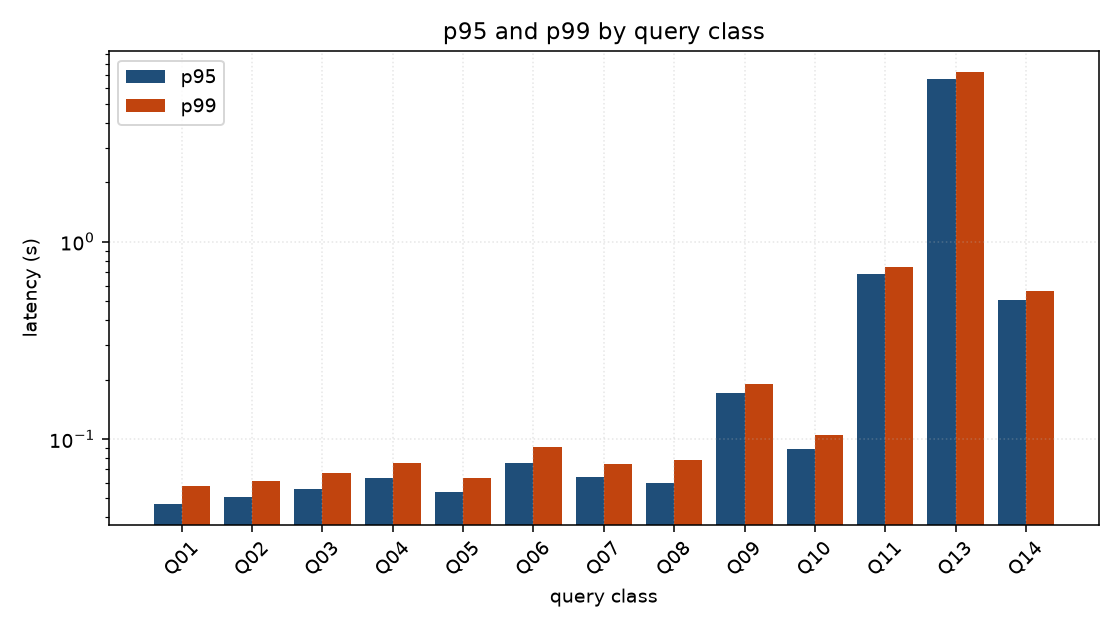
Latency by query class
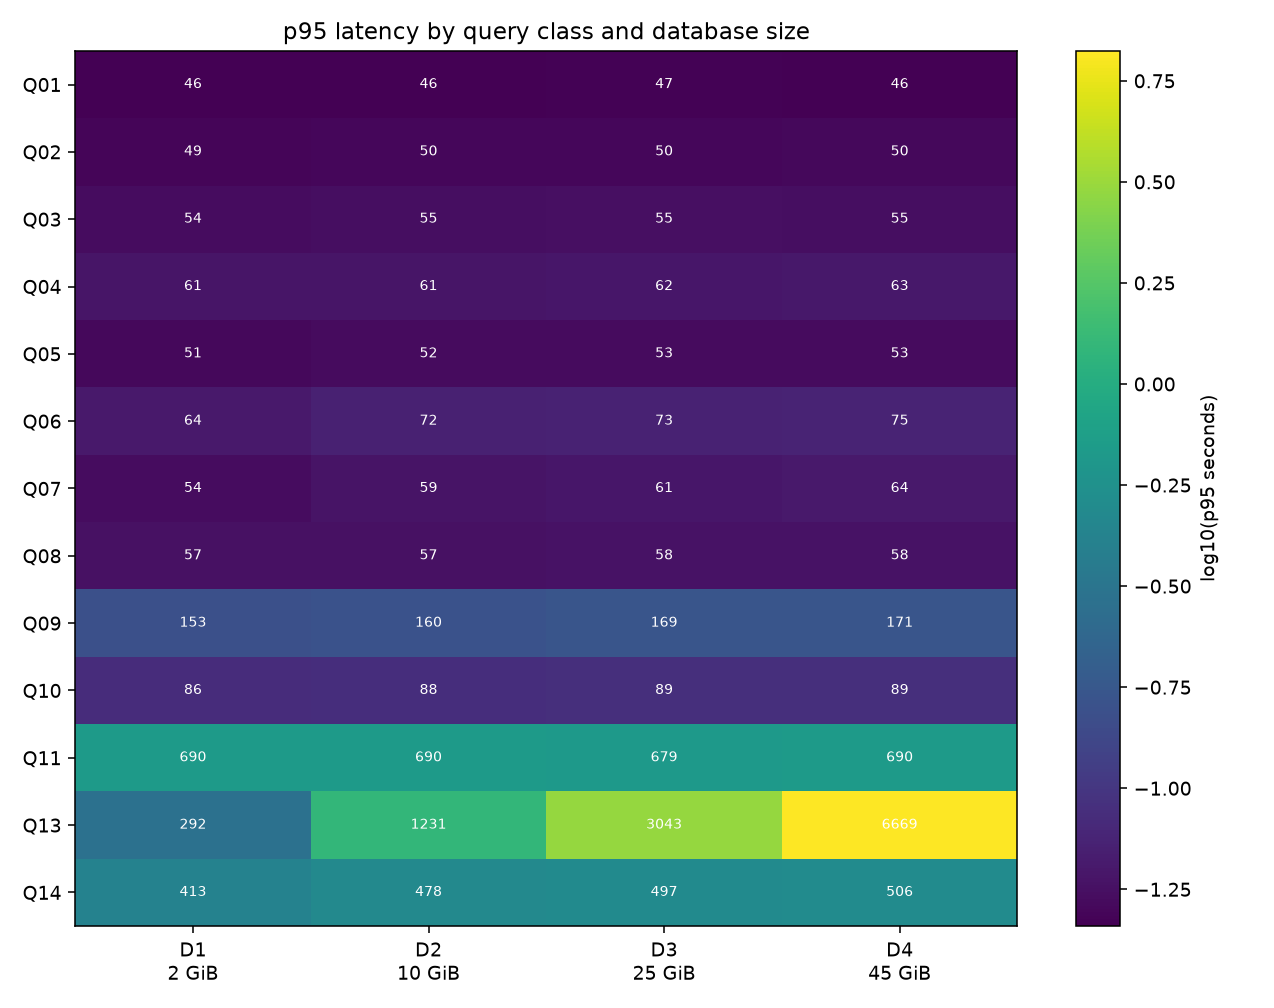
Query class against database size
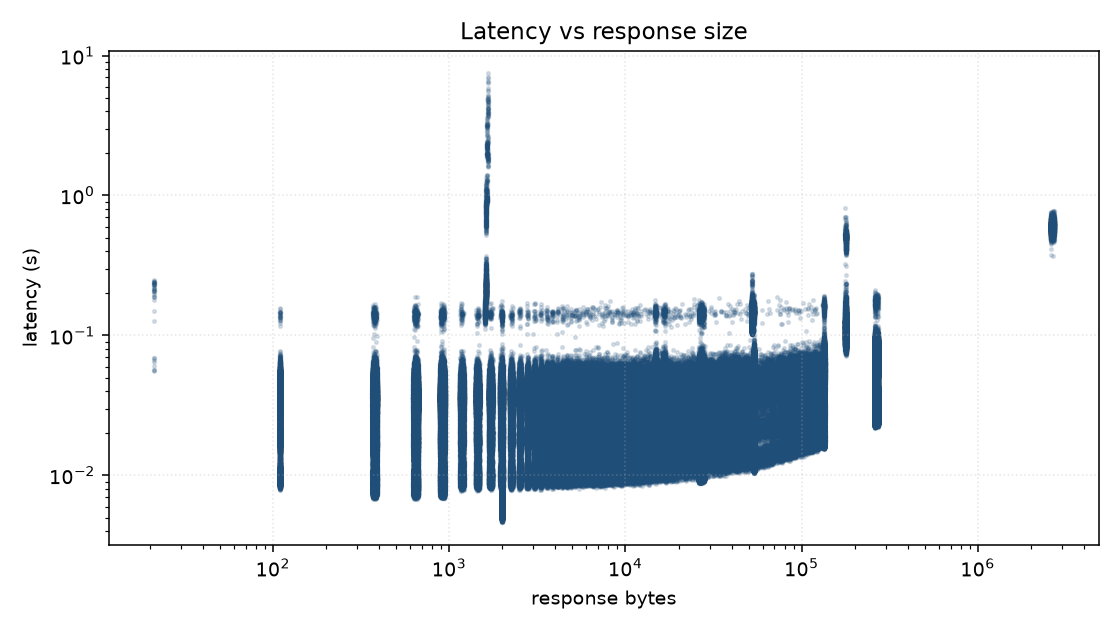
Latency against response size
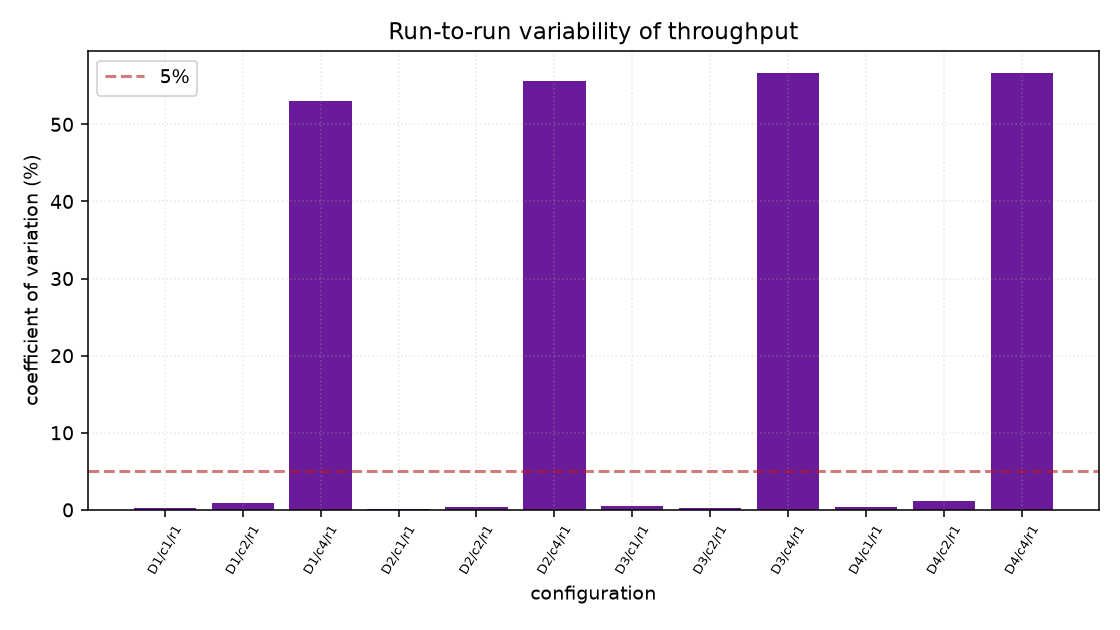
Run-to-run variability
Environment
| property | value |
|---|---|
| host | Linux-6.8.0-134-generic-x86_64-with-glibc2.39 (30 CPUs) |
| Kubernetes | v1.33.1 |
| node capacity | 30 CPU, 126738624Ki |
| KEDA | ghcr.io/kedacore/keda:2.18.1 |
| PostgreSQL | PostgreSQL 18.6 (Debian 18.6-1.pgdg13+2) on x86_64-pc-linux-gnu, compiled by gcc (Debian 14.2.0-19) 14.2.0, 64-bit |
| extensions | pg_sphere 1.5.2, pg_stat_statements 1.12, plpgsql 1.0 |
| seed | 20260823 |
| corpus sha256 | 45623decb402cb2d |
| chart values sha256 | d2e1f81d36fe3b3b |
Download the per-measurement CSV · environment.json · dataset.json
Raw per-request samples and Prometheus series stay with the run that
produced them, under benchmarks/tap-performance/results/20260825T005436Z-b450b0a9-db-scaling/:
Parquet for every request and every metric, PostgreSQL statistics
before and after, EXPLAIN plans, and the exact ScaledObject and HPA
YAML the measurement ran against.